 DogHush
In New York City’s public 311 records, barking-dog complaints peak in the late morning: 10 to 11 a.m. is the busiest hour, with 6.4% of all complaints, and the level stays high until about 11 p.m. The quietest hour is 4 to 5 a.m., with 0.8%. Tuesday is the busiest day and Sunday the quietest, spring and fall are the busiest seasons, and July is the quietest month in every year studied. Complaints rose from 4,595 in 2020 to 8,329 in 2025, the highest yearly total since at least 2010; the patterns cover all 42,322 complaints filed from January 2020 through December 2025.
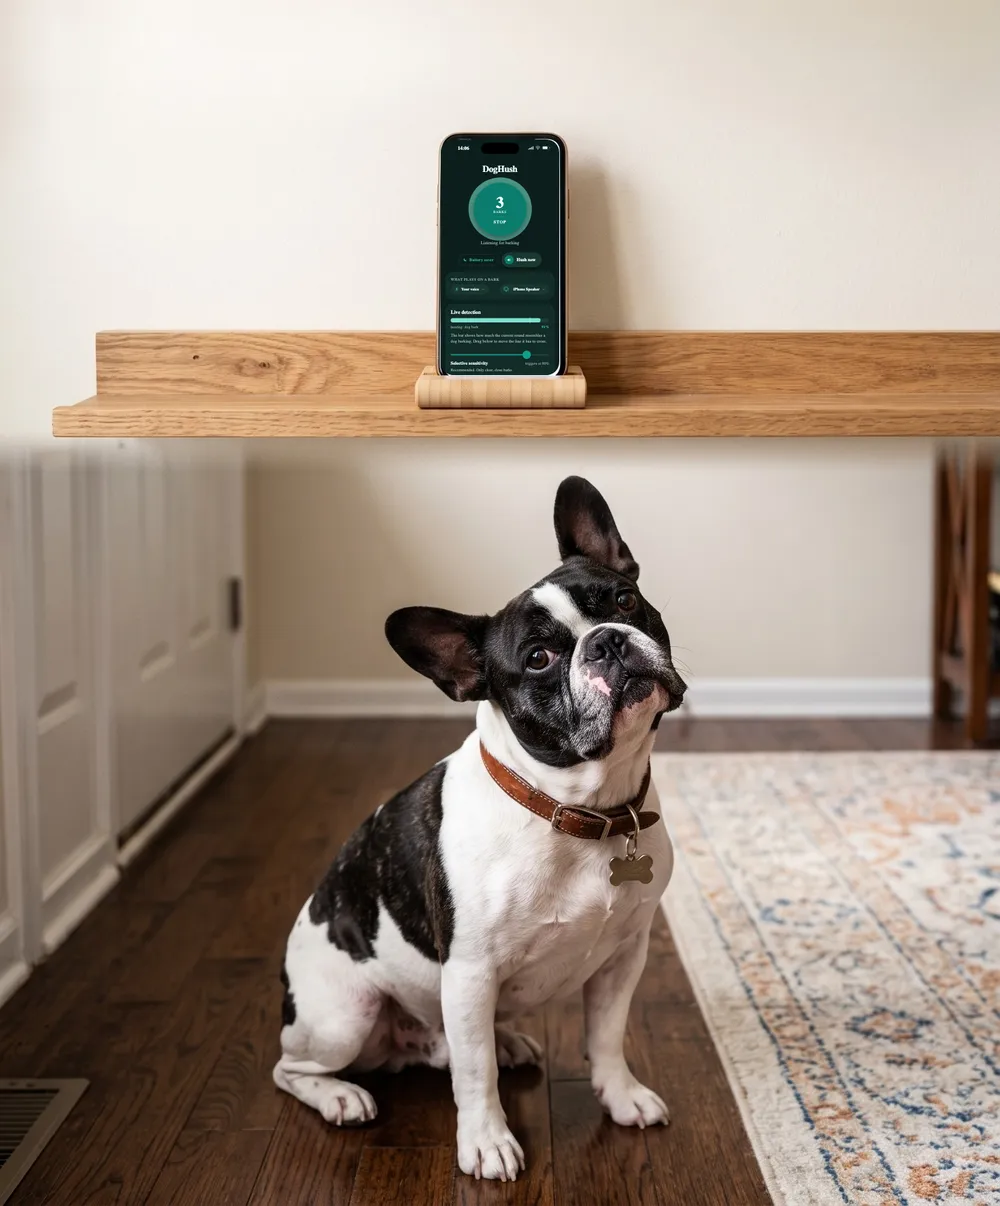
DogHush answers every bark in your own voice and logs when it happened, hour by hour.
★★★★★ “It worked way better than I thought.” App Store review
3 days free · Cancel anytime
Are barking complaints going up?
Yes, steadily since 2020. From 2010 to 2019 the city logged 6,134 to 7,551 a year. 2020, the first pandemic year, was the low point; each year since has been higher, though 2025 beat 2024 by a single complaint. Those two years are the highest in the series, about 21% above the 2010–2019 average. 2026 is slightly ahead again: 6,648 complaints from January 1 to October 12, against 6,552 in the same weeks of 2025.
| Year | Complaints | Year | Complaints |
|---|---|---|---|
| 2010 | 6,287 | 2018 | 6,261 |
| 2011 | 6,134 | 2019 | 7,235 |
| 2012 | 6,843 | 2020 | 4,595 |
| 2013 | 7,298 | 2021 | 6,112 |
| 2014 | 7,551 | 2022 | 7,213 |
| 2015 | 7,499 | 2023 | 7,745 |
| 2016 | 6,731 | 2024 | 8,328 |
| 2017 | 6,901 | 2025 | 8,329 |
Barking-dog complaints to NYC 311 by calendar year. 2010–2019 from the city’s 2010–2019 dataset, 2020–2025 from its 2020-to-present dataset.
A rising count doesn’t prove there is more barking. It can also mean more dogs, more people home by day, or more people who know 311 takes barking complaints.
What time of day do people complain about barking?
Mostly in the daytime and evening. Complaints climb fast from 7 a.m., peak between 9 a.m. and noon, ease through the afternoon and rise to a smaller peak around 8 p.m. The hours from 8 a.m. to 6 p.m., when many owners are at work, account for 54% of complaints. The 10 a.m. hour gets eight times as many as the 4 a.m. hour.
Weekdays and weekends look different. On weekdays the busiest hour is 10 to 11 a.m., and 9 a.m. to noon alone holds 19% of complaints. On weekends the morning peak is lower and the busiest hour is 10 to 11 p.m.; 10 p.m. to 2 a.m. holds 19% of weekend complaints, against 13% on weekdays. The same shape appears in each of the six years separately.
| Hour filed | Complaints | All days | Mon–Fri | Sat–Sun |
|---|---|---|---|---|
| Midnight–1 a.m. | 1,311 | 3.1% | 2.7% | 4.2% |
| 1–2 a.m. | 862 | 2.0% | 1.6% | 3.3% |
| 2–3 a.m. | 593 | 1.4% | 1.2% | 2.0% |
| 3–4 a.m. | 393 | 0.9% | 0.8% | 1.3% |
| 4–5 a.m. | 337 | 0.8% | 0.7% | 1.1% |
| 5–6 a.m. | 367 | 0.9% | 0.9% | 0.7% |
| 6–7 a.m. | 748 | 1.8% | 1.9% | 1.4% |
| 7–8 a.m. | 1,422 | 3.4% | 3.8% | 2.2% |
| 8–9 a.m. | 2,101 | 5.0% | 5.3% | 4.1% |
| 9–10 a.m. | 2,528 | 6.0% | 6.4% | 4.8% |
| 10–11 a.m. | 2,699 | 6.4% | 6.6% | 5.9% |
| 11 a.m.–noon | 2,553 | 6.0% | 6.3% | 5.4% |
| Noon–1 p.m. | 2,362 | 5.6% | 5.6% | 5.5% |
| 1–2 p.m. | 2,230 | 5.3% | 5.3% | 5.3% |
| 2–3 p.m. | 2,215 | 5.2% | 5.4% | 4.8% |
| 3–4 p.m. | 2,138 | 5.1% | 5.2% | 4.5% |
| 4–5 p.m. | 2,104 | 5.0% | 5.0% | 4.8% |
| 5–6 p.m. | 2,070 | 4.9% | 4.9% | 4.9% |
| 6–7 p.m. | 2,208 | 5.2% | 5.2% | 5.3% |
| 7–8 p.m. | 2,353 | 5.6% | 5.5% | 5.8% |
| 8–9 p.m. | 2,402 | 5.7% | 5.6% | 5.9% |
| 9–10 p.m. | 2,241 | 5.3% | 5.1% | 5.7% |
| 10–11 p.m. | 2,239 | 5.3% | 4.9% | 6.2% |
| 11 p.m.–midnight | 1,834 | 4.3% | 4.1% | 5.0% |
Complaints by the hour they were filed, New York time, 2020–2025: 42,310 complaints (12 stamped exactly midnight left out; see the method). Each percentage column adds up to 100%. Days are calendar days, so 1 a.m. on a Saturday counts as weekend.
Which day of the week gets the most complaints?
Tuesday, narrowly. The differences are small: weekdays average about 20 complaints a day citywide, weekend days about 18, and Sunday is the quietest.
| Day | Complaints | Share | Per day |
|---|---|---|---|
| Monday | 6,025 | 14.2% | 19.2 |
| Tuesday | 6,384 | 15.1% | 20.4 |
| Wednesday | 6,198 | 14.6% | 19.7 |
| Thursday | 6,194 | 14.6% | 19.8 |
| Friday | 6,064 | 14.3% | 19.4 |
| Saturday | 5,925 | 14.0% | 18.9 |
| Sunday | 5,520 | 13.0% | 17.6 |
2020–2025, 42,310 complaints. “Per day” is the average number of complaints citywide on that weekday.
Is there a barking season?
Yes. Spring and fall are the busiest seasons, at about 22 complaints a day, and summer the quietest, at about 15. July is the quietest month in each of the six years, with roughly half the daily rate of May or October. Summer travel and windows shut for air conditioning are plausible reasons, but the data can’t confirm them.
| Month | Complaints | Share | Per day |
|---|---|---|---|
| January | 3,217 | 7.6% | 17.3 |
| February | 3,198 | 7.6% | 18.8 |
| March | 3,996 | 9.4% | 21.5 |
| April | 3,962 | 9.4% | 22.0 |
| May | 4,322 | 10.2% | 23.2 |
| June | 3,187 | 7.5% | 17.7 |
| July | 2,301 | 5.4% | 12.4 |
| August | 2,987 | 7.1% | 16.1 |
| September | 3,793 | 9.0% | 21.1 |
| October | 4,340 | 10.3% | 23.3 |
| November | 3,656 | 8.6% | 20.3 |
| December | 3,363 | 7.9% | 18.1 |
2020–2025, all 42,322 complaints. “Per day” adjusts for the length of each month.
Which borough complains the most?
Brooklyn, with a third of the city’s barking complaints. Per resident, though, Staten Island is highest, at about 110 complaints per 100,000 people a year, and the Bronx is lowest, at about 68. The Bronx is also where complaints have grown fastest, from 537 in 2020 to 1,381 in 2025.
| Borough | Complaints 2020–2025 | Share | Per 100,000 residents a year | Change, 2020 to 2025 |
|---|---|---|---|---|
| Brooklyn | 14,024 | 33.1% | 88 | +87% |
| Queens | 10,586 | 25.0% | 75 | +72% |
| Manhattan | 8,721 | 20.6% | 89 | +77% |
| Bronx | 5,714 | 13.5% | 68 | +157% |
| Staten Island | 3,277 | 7.7% | 110 | +16% |
| New York City | 42,322 | 100% | 83 | +81% |
Rates use the US Census Bureau’s July 1 population estimate for each year, 2020–2025 (Vintage 2025); each borough is a county.
Boroughs differ in housing and in how readily people call 311; the data can’t tell which drives the gap.
What does this mean if you own a dog?
The complaint clock is mostly the working day, and weekday mornings stand out. If your dog barks after you leave, that is when a neighbor is most likely to report it, and you aren’t there to hear it. The ASPCA notes that barking only when a dog is alone can be a sign of separation distress, and that dogs left alone for long periods may need more exercise, mental stimulation and company. What to do about barking when you’re out.
- Find out what really happens. Record a few ordinary weekdays from the moment you leave, and keep a dated log. How to record it properly.
- Don’t ignore the nights. About 21% of complaints come in between 10 p.m. and 7 a.m., the hours when New York’s code treats 5 minutes of continuous barking as unreasonable, instead of 10 minutes by day.
- If you’ve had a complaint, answer it with a plan and a record, not a defense. What to do next.
- If the dog is your neighbor’s, note the times too; a dated log is the first thing officials ask for. How to raise it without a feud.
For your own dog, DogHush keeps a 12-hour chart and a daily and weekly history of the barking it picks up while your iPhone stays at home with the app open, so you can see whether your dog’s busy hours look like the city’s. It does nothing about a neighbor’s dog.
How we got these numbers
- Data. NYC Open Data’s 311 Service Requests “2020 to Present” (erm2-nwe9) and, for the 2010–2019 trend, “2010 to 2019” (76ig-c548). The city split its original 2010-to-present file, so erm2-nwe9 now starts on January 1, 2020.
- Filter. Complaint type “Noise” with the descriptor “Noise, Barking Dog (NR5)”, which the city routes to its Department of Environmental Protection. In 2026 the city began using a second descriptor, “Dog”, for the same complaint; we count both (it appears only twice before 2026). There is no “Noise - Animal” complaint type in this data.
- Years. Complete calendar years only: 2010–2025 for the trend, 2020–2025 (42,322 complaints) for hours, days, months and boroughs. The only 2026 figure is the year-to-date comparison.
- Queries. Aggregate counts through the city’s open data API, run on October 14, 2026; no individual records downloaded. Times are when each complaint was logged, New York time. 84% came in online, 16% by phone.
- The midnight check. Records with no real time often show up as exactly 00:00:00. Only 12 complaints carry that stamp, about as many as other on-the-hour times (27 at exactly noon), so there is no artificial spike; we left them out of the hour and weekday tables anyway. Minutes follow a regular, mechanical-looking pattern, so we report nothing finer than the hour.
- Population. US Census Bureau county estimates for July 1 of each year, 2020–2025.
What can’t these numbers tell you?
Complaints measure neighbors annoyed enough to report, not barking. A complaint is filed when someone is awake, home and bothered, so a night of barking may be reported the next morning, and the daytime peak partly reflects when complainers are home. Reporting habits differ by neighborhood, housing and familiarity with 311. One dog, or one determined neighbor, can produce dozens of complaints. And this is one city; others may keep a different clock.
The filter and dates above are enough for anyone to rerun these counts. You are welcome to cite these figures with a link to this page.
Sources
- NYC Open Data. 311 Service Requests from 2020 to Present (dataset erm2-nwe9). https://data.cityofnewyork.us/Social-Services/311-Service-Requests-from-2020-to-Present/erm2-nwe9
- NYC Open Data. 311 Service Requests from 2010 to 2019 (dataset 76ig-c548). https://data.cityofnewyork.us/Social-Services/311-Service-Requests-from-2010-to-2019/76ig-c548
- US Census Bureau. County Population Totals and Components of Change: 2020–2025 (Vintage 2025). https://www.census.gov/data/tables/time-series/demo/popest/2020s-counties-total.html
- New York City Administrative Code §24-235, Animals (noise). https://nycadmincode.readthedocs.io/t24/c02/sch06/
- ASPCA. Common Dog Behavior Issues: Barking. https://www.aspca.org/pet-care/dog-care/common-dog-behavior-issues/barking
This guide is general information about dog behaviour, not veterinary advice. A sudden change in barking, or barking with signs of distress, is a reason to see a vet.